Know your footprint
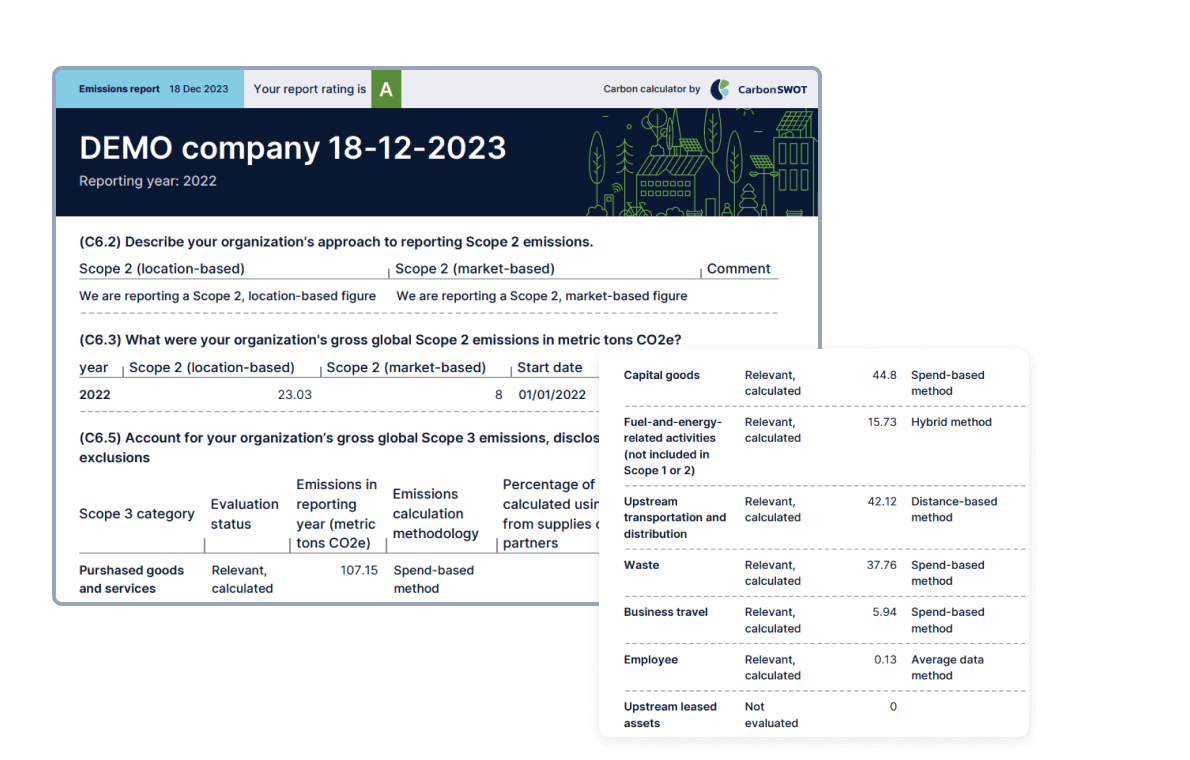
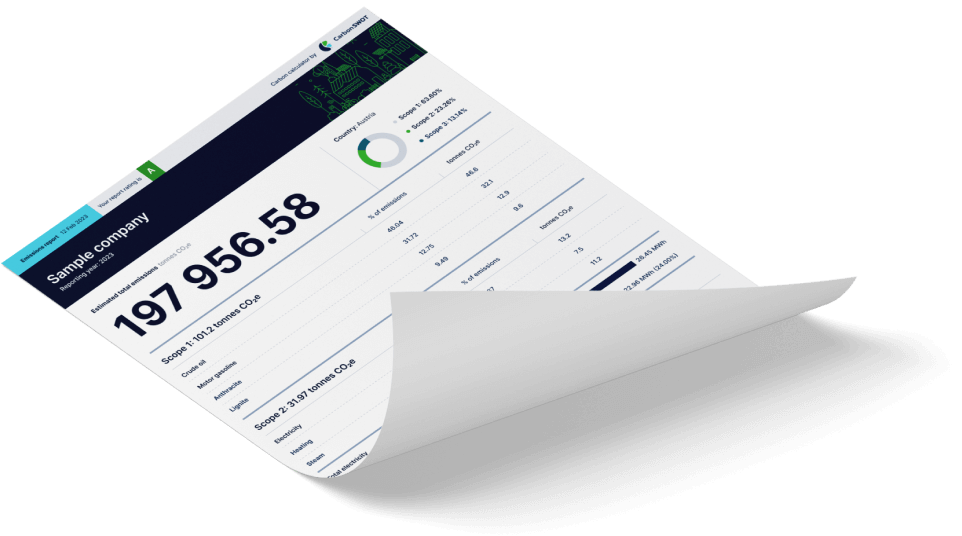
Having done the calculation you can publish your carbon emissions report on your website, provide it on request to your counterparties as well as regulatory organizations.
Calculate
A Smart Full-Cycle
Understand what a GHG calculation involves and what data you need
Collect all the necessary data to perform a calculation
Start calculating emissions
Create, view and export your ESG reports
Set reduction targets and plan corresponding measures
Implement customized reduction measures and track their performance
Nurture a sustainable culture in your company
Know your suppliers’ actual emissions
Have your results checked for plausibility
Reach CO2 neutrality
Create, observe, export your ESG reports
Step 1
Step 2
Step 3
Step 4
Step 5
Step 6
Step 7
Step 8
Step 9
Step 10
Step 0
CarbonSWOT offers specific and tailored solutions in climate care and carbon footprint management to effectively address the unique needs of your business.

Calculate the CO2 emissions needed for a CDP’s questionnaire with CarbonSWOT
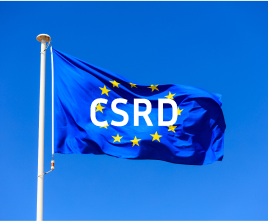
Prepare for Corporate Sustainability
Reporting Directive (CSRD)
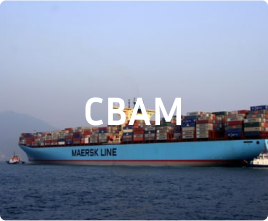
Assess the estimated amount of CBAM certificates and fines for your imports

Use CarbonSWOT to calculate your business’ CO2 footprint to share it with customers upon their requests

Simplify the process of collecting emissions data from your suppliers

Create your climate strategy and start building your ESG rating

A tailored solution adjusted specifically to cover your company’s unique needs

Choose one of our certified offsetting programs

Support and promote your climate strategy with CO2 neutral events

Reduce shipments’ GHG emissions as a crucial aspect of sustainable supply chain management
01
Studying our platform for the first time with educational materials or our ESG expert’s help, you will be able to make further calculations on your own.
02
Our tool is powered by a state-of-the-art algorithm that enables us to provide a unique approach to calculation, reporting and reduction, and elevates us over the competition.
03
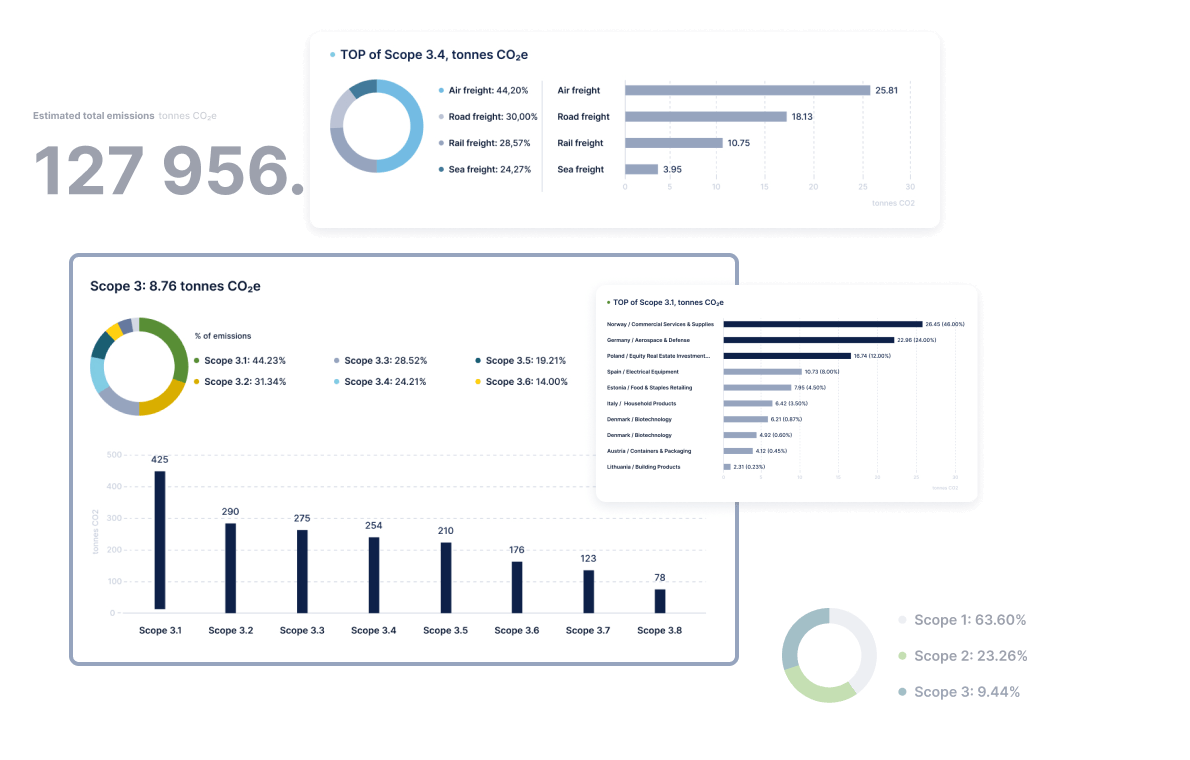
What you’ll get after a calculation is so much more than just an overview of your emissions. You’ll have them broken down by Scopes and types, compared to country/region/world averages, and analyzed in a SWOT table with reduction recommendations and the advice on improving calculation.
04
CarbonSWOT covers the carbon emissions part of the CDP questionnaire. You can use our tool to calculate the necessary data and paste it there.
05
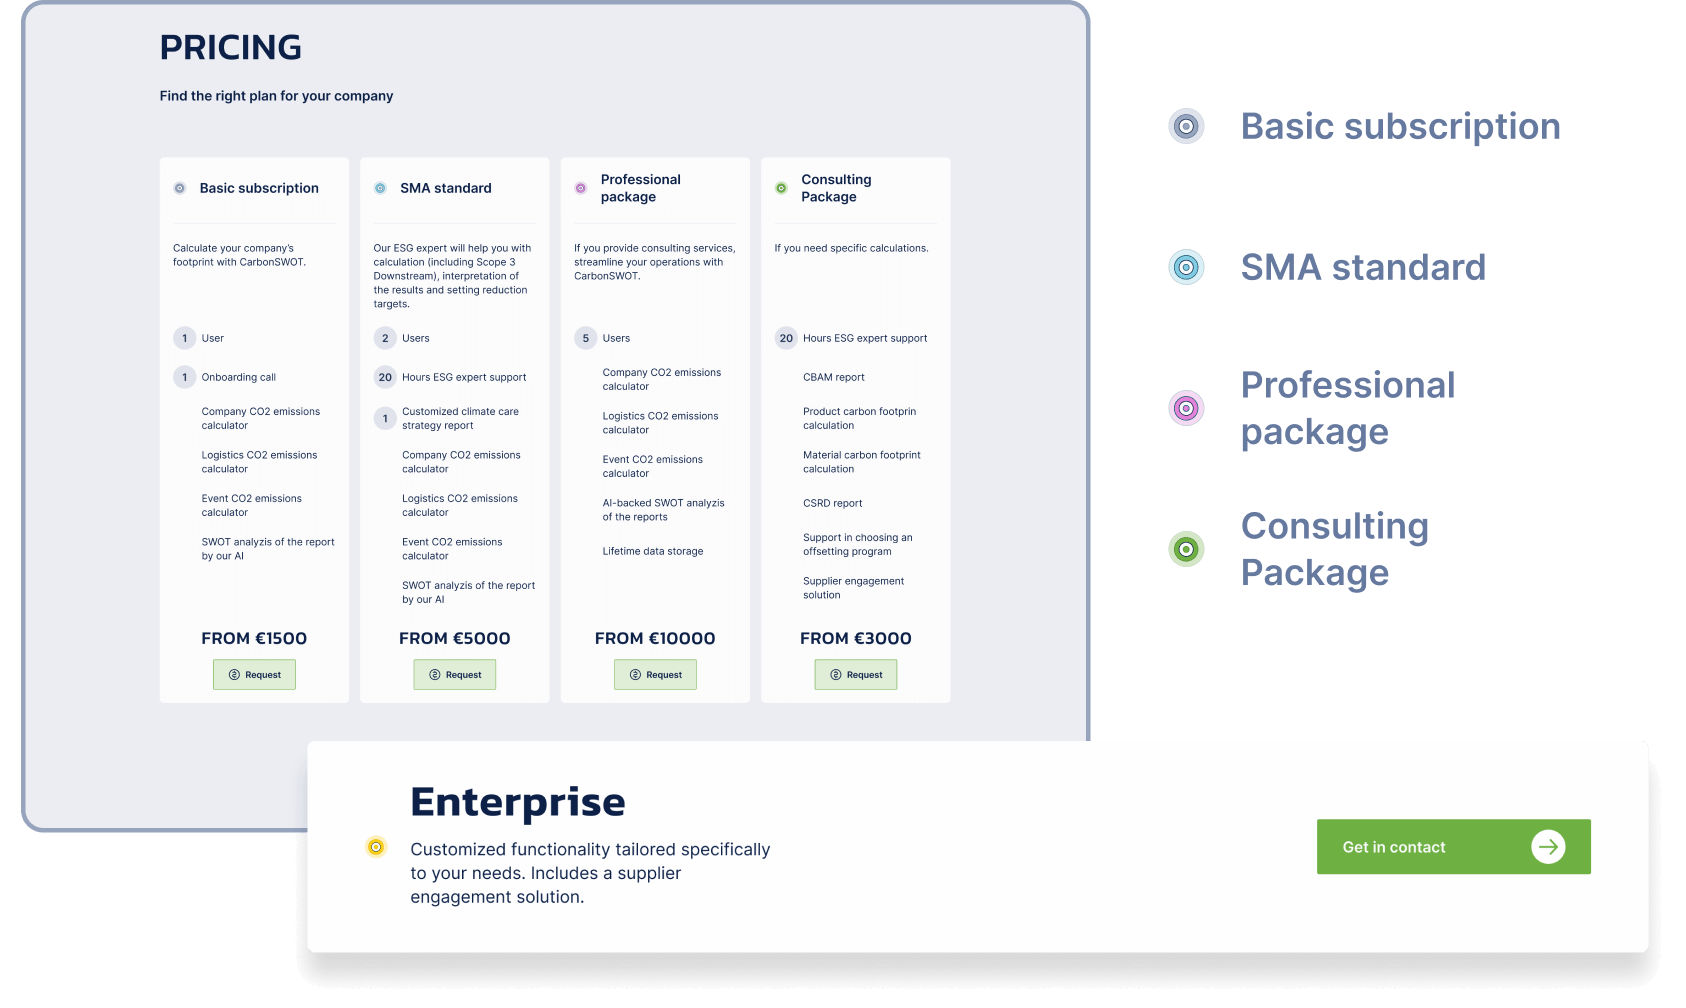
Our rates are significantly lower than the average market prices
06
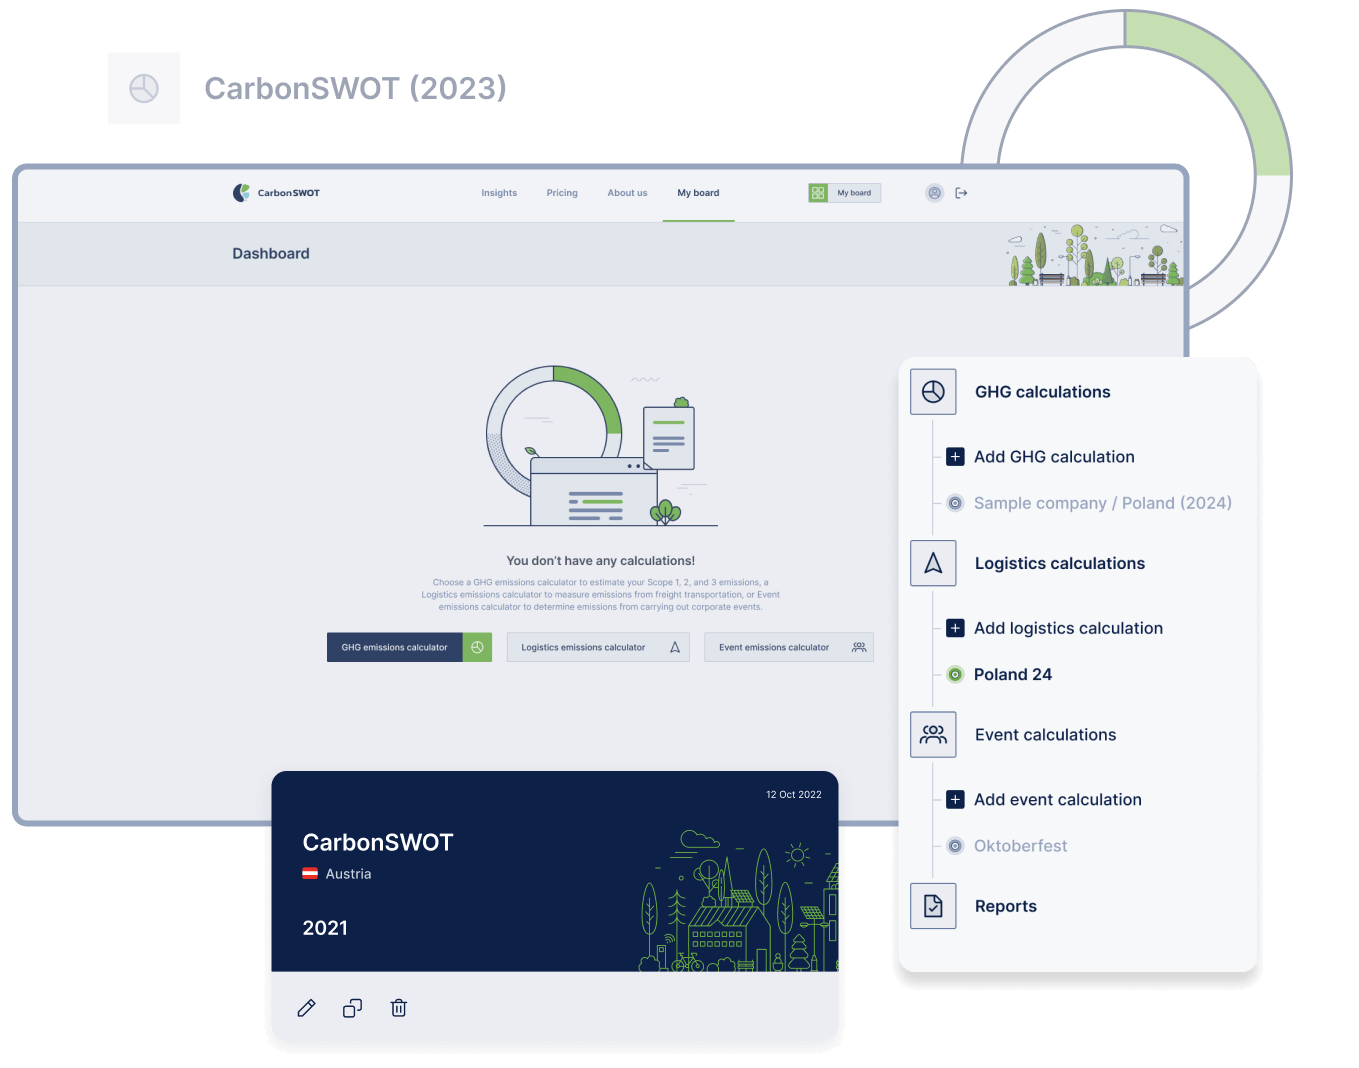
You can calculate company, logistics, and events footprints. And there’s more to come!
07
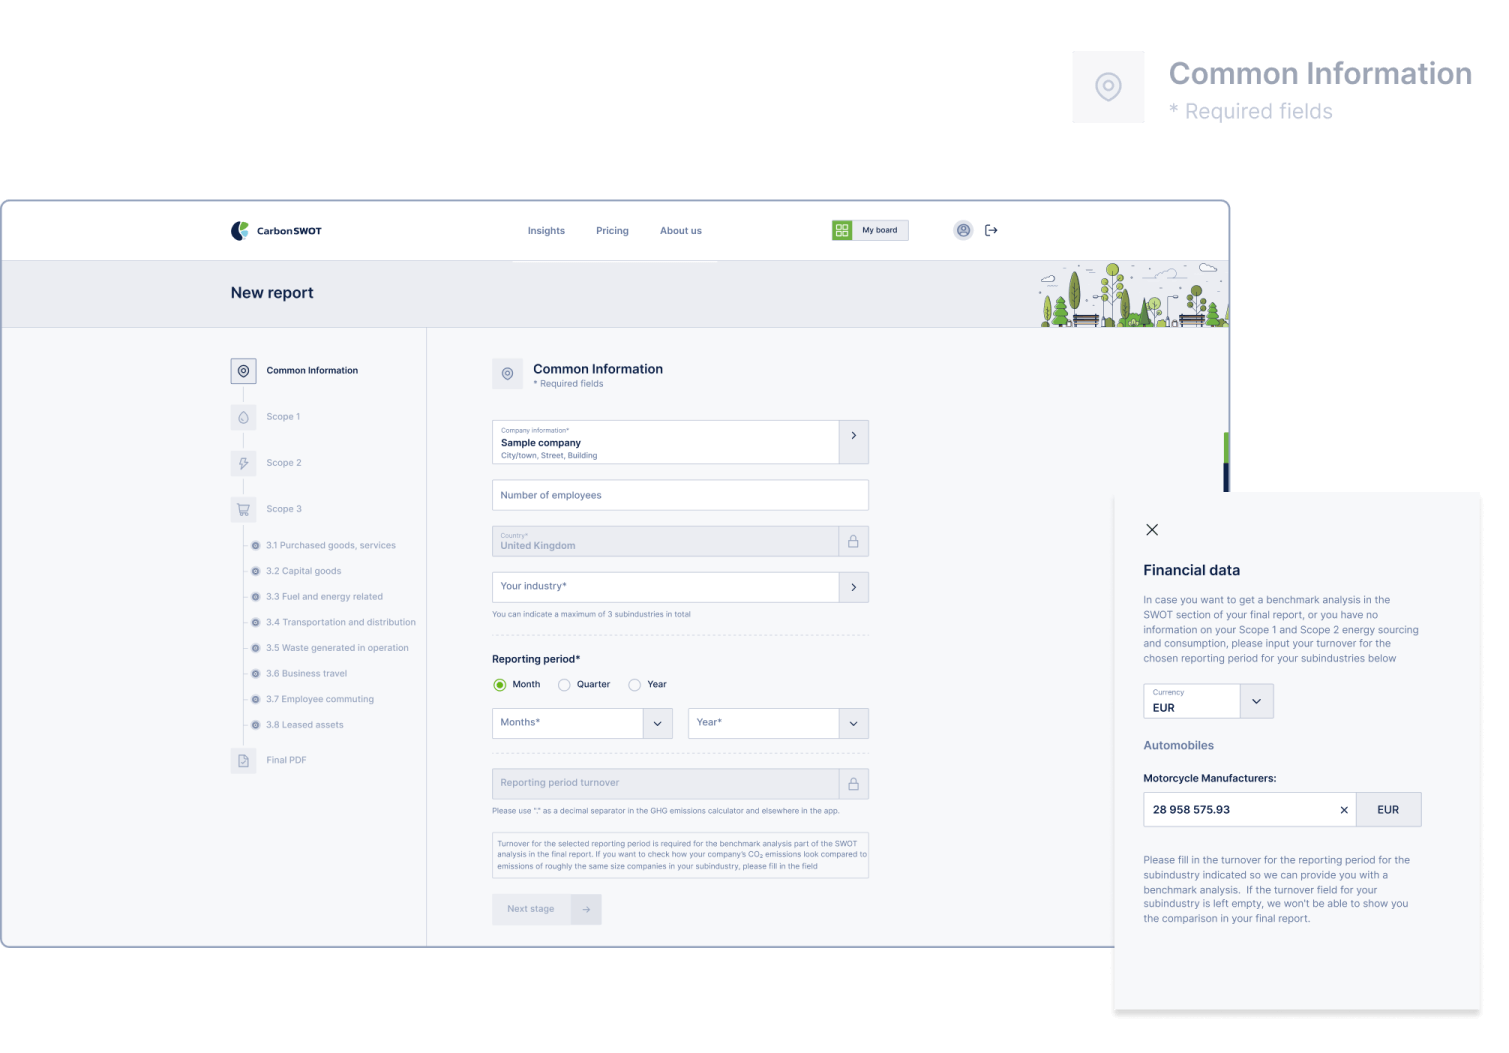
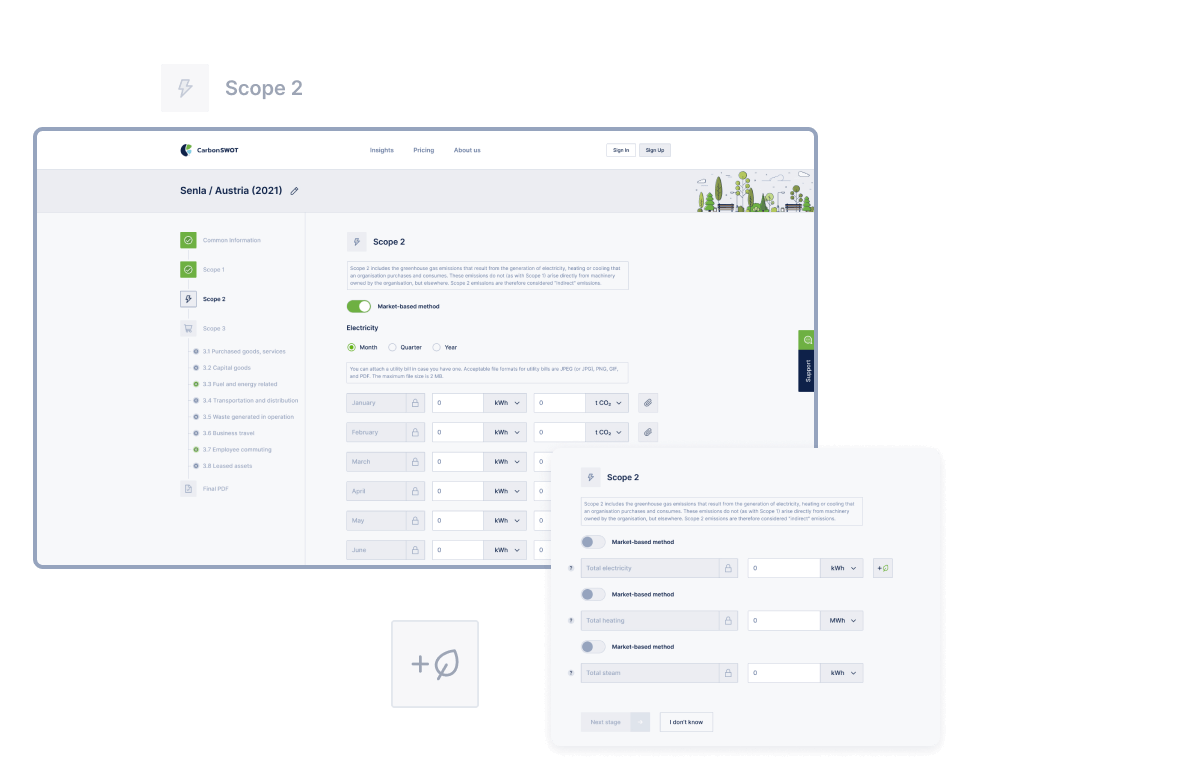
Where possible, you’ll have a choice between calculation options to make the process the most convenient for you. For example, for Scope 2 you can use either a traditional or a market-based input method. And for Scope 3.4 “Transportation and distribution” you can choose between a traditional and a distance-based method.

There are a lot of regulations already in place and even more to come. An advanced developed climate strategy allows companies not only avoid present fines, but also future-proof their operations.
Proactively addressing climate change often involves embracing innovation. Companies that invest in sustainable technologies and practices position themselves as industry leaders, driving innovation
and staying ahead of competitors.
reducing material waste through zero and low-waste policies can help improve operating profits by as much as 60%
of institutional investors said they were more likely to divest from companies with poor sustainability performance, while 90% said they would now pay more attention to a company’s sustainability performance when making investment decisions
of companies say their sustainability initiatives increase customer loyalty and 63% have seen growth in sales
of employees said that if a company had a strong sustainability plan, it would affect their decision to stay with that company long term
the transition to a net-zero economy could create up to €8 trillion in business opportunities in Europe alone by 2050. Companies that are slow to transition risk losing market share and competitiveness
the transition to energy effective solution usually pays off in 1.5 years
reducing material waste through zero and low-waste policies can help improve operating profits by as much as 60%.
of institutional investors said they were more likely to divest from companies with poor sustainability performance, while 90% said they would now pay more attention to a company’s sustainability performance when making investment decisions.
of companies say their sustainability initiatives increase customer loyalty. 63% have seen growth in sales.
of employees said that if a company had a strong sustainability plan, it would affect their decision to stay with that company long term.
the transition to a net-zero economy could create up to €8 trillion in business opportunities in Europe alone by 2050. Companies that are slow to transition risk losing market share and competitiveness.
transition to energy effective solution usually pays off in 1.5 years.
Our calculator is developed in strict accordance with the Greenhouse Gas Protocol (GHGP) so that our customers can rely on the tool’s reports’ quality. Our database includes balanced emission factors for thousands of industries all over the world.
All related factors are taken into account when we calculate Scope 1, 2 and 3 emissions.

Direct greenhouse gas emissions that occur from sources that are owned or controlled by your company, for example, emissions from combustion in vehicles’ engines, boilers and furnaces.
Any kind of fuel that is directly burned counts in:
Diesel
Biofuel
LPG
Natural gas
Coal
Oil products
Greenhouse gas emissions from the generation of purchased electricity and heating consumed by the company. Even if your company doesn’t burn any fuels directly, it uses electricity, hence some fuel needs to be burned on a power plant to generate the electric power.
Using energy of any kind generates significant CO2 emissions on the providers’ side which also counts towards your total emissions.
Emissions that are a consequence of the business activities of your company occurring from sources not directly owned or controlled. These are logistics, buying raw materials, leasing assets, business travel by the team, treatment of waste generated in operations and various other activities that generate a considerable share of your corporate carbon footprint.
Energy wasted during electricity transmission in the electric grid also counts as a part of Scope 3, as there may be significant loss in some grids.
Having done the calculation you can publish your carbon emissions report on your website, provide it on request to your counterparties as well as regulatory organizations.
Calculate
View all
With CarbonSWOT, you can be sure that you’ll achieve your set decarbonization targets. Our top-rated solution simplifies calculation to the maximum and guides you at every step.
Where it’s not enough, our great team of ESG and IT experts will be happy to step in. From helping calculate and report to setting targets and adjusting the system to you, CarbonSWOT is there to hold your back at any step of your decarbonization journey.